Utilizing Open Source Technologies with the Proprietrary ESRI ArcGIS JavaScript SDK to Self Host Spatial Data for an Interactive Transit Map
Justin DeKock | Saint Louis University | M.S. Information Systems | Mentor: Maria Weber
Project purpose:
The purpose of the project is to provide an interactive way for researchers, policy makers, and people generally interested to explore geospatial and demographic data as it pertains to the access to transit in the St. Louis Metropolitan Area. While some of the project's features may be useful for transit riders, the primary intent of the project is not to provide accurate and up to date information to riders about the St. Louis Metro Transit system. Riders should visit the Metro Transit website for updated information on frequencies, alerts, etc.
Data Sources:
- General Transit Feed Specification (GTFS) Data
- Provided by St. Louis Metro Transit
- US Census Bureau Data:
- American Community Survey (ACS) 2024 Dataset
- TIGER (Toplogically Integrated Geographic Encoding and Referencing) 2024 Dataset
- Misc. Spatial Data
- Provided by Open Street Map (OSM)
Open Source Technologies Utilized:
- Docker
- To containerize application components
- Postgres/PostGIS
- Reliable and accessible storage of spatial data
- NGINX
- Proxy web server for caching, forwarding requests, serving static files, etc.
- Go Programming Language
- Backend API written in Go to take advantage of performance increases from a compiled language
- Open Street Map (OSM)
- Massive community driven GIS project
Open Source Projects Utilized:
- gtfs-via-postgres
- GTFS data into Postgres
- osmium
- Concatenate several OSM export files
- osm2pgsql
- Import OSM export file into Postgres
- ogr2ogr
- Import TIGER data into Postgres
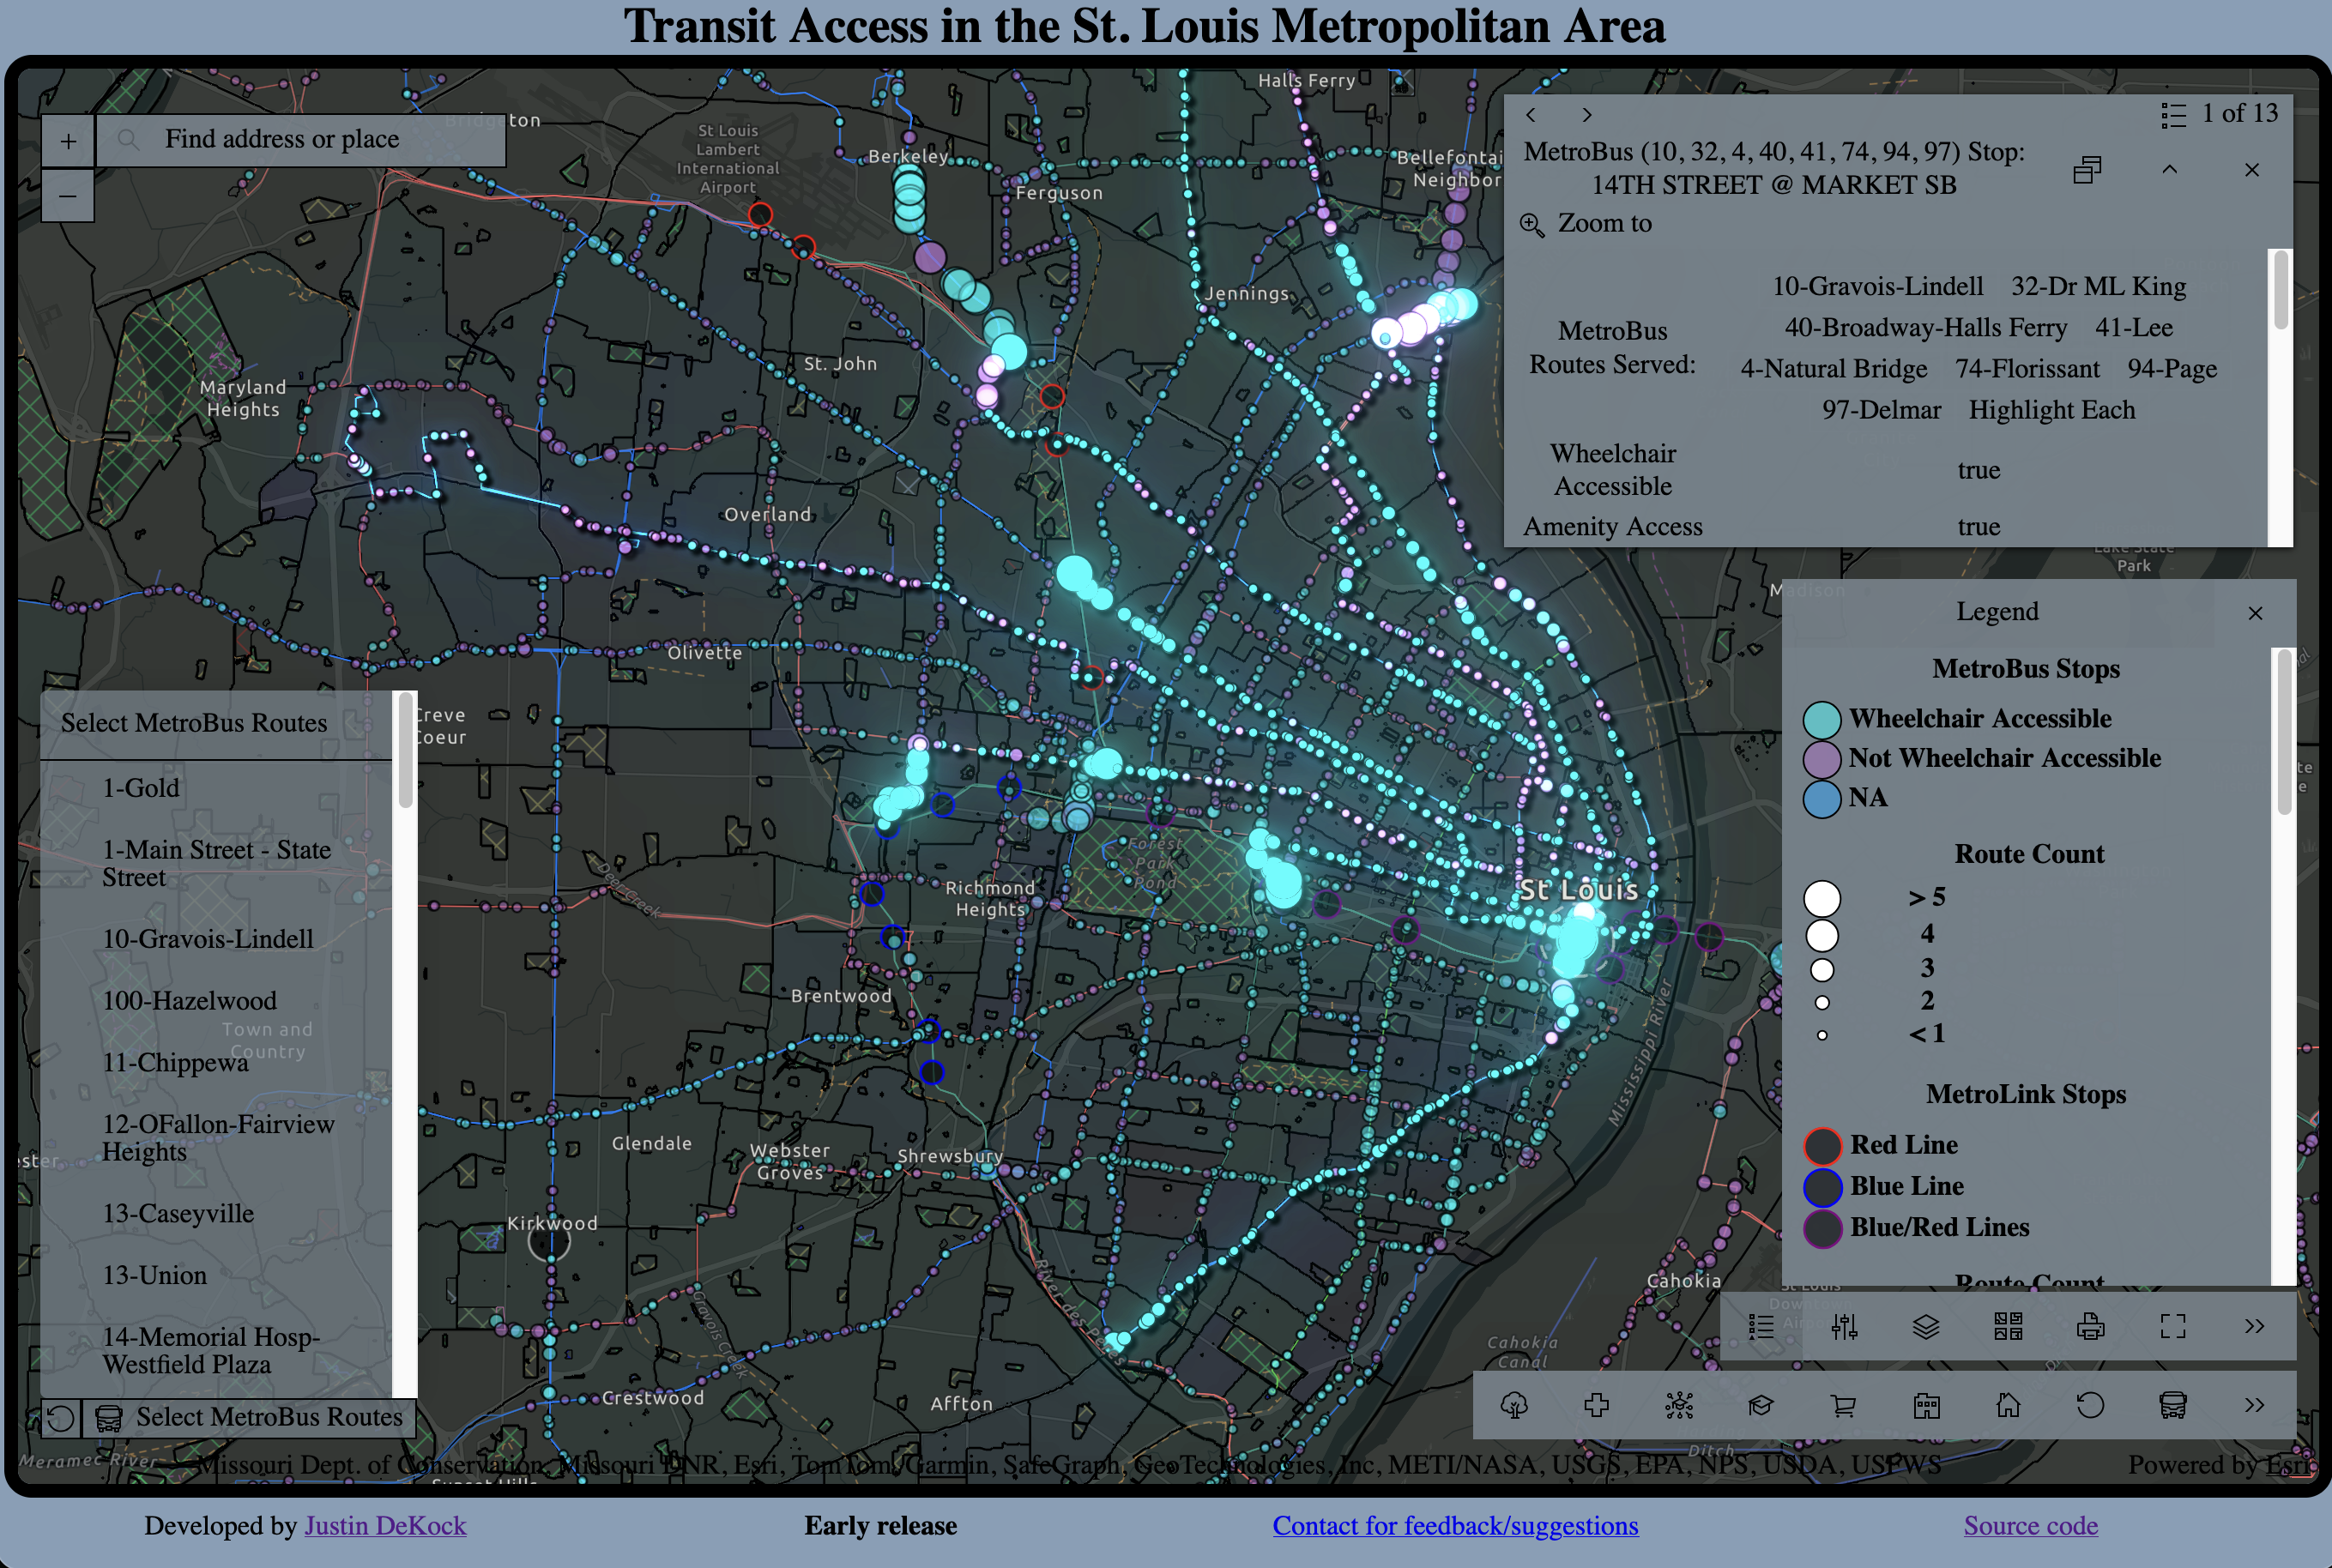
Useful Features:
- Visual customizations
- Every visual element of the map can be modified in some way to create more useful visualizations
- Proximity to transit stops
- Each rendered polygon includes a reference to every transit stop within 0.5mi of its perimeter
- From the polygon's popup, each route with a stop within that distance can be highlighted
- Stop/route line rendering
- The visual appearance of each rendered stop/route line is based on data regarding that stop/line
- Stops are sized according to the number of routes that serve said stop
- Route lines are colored based on their weekday frequency
Intended Improvements:
This project is still in early release. I plan on adding a number of features before formally releasing.- Real-time data integration
- Real-time estimates for the next expected vehicle arrival will be implemented for each stop
- Real-time GTFS data may be introduced to provide real-time renderings for selected routes
- Additional web pages
- Informational pages will be added with charts/tables/graphs detailing transit routes, demographics served by routes, etc.